During the last trading week, Bitcoin (BTC) struggled to achieve any notable price breakout, facing rejections around the $86,000 mark. The market has not experienced any significant price pullback; however, the pronounced sideways price movement suggests a considerable degree of investor uncertainty. In a noteworthy development, renowned market analyst Daan Crypto, known for his insights under the username X, has delivered a compelling technical analysis of the BTC market. He emphasizes the current obstacles that are hindering upward price momentum.
Bitcoin Faces Key Challenges on 200-Day EMA, 200-Day MA, and Diagonal Trendline. Following its peak in late January, Bitcoin has experienced a significant downturn, with a decline exceeding 22% in its market value. The recent decline in prices can largely be attributed to ongoing international trade tariff crises, prompting investors to pivot towards safer assets in search of stability.
In early April, a price rebound was observed, coinciding with a halt in new tariffs and the initiation of global negotiations. Bitcoin is currently facing challenges in breaking through the $84,000-$86,000 range, as it continues to consolidate within a narrow band. Bitcoin has emerged as a significant player in the financial landscape, capturing the attention of investors and analysts alike.
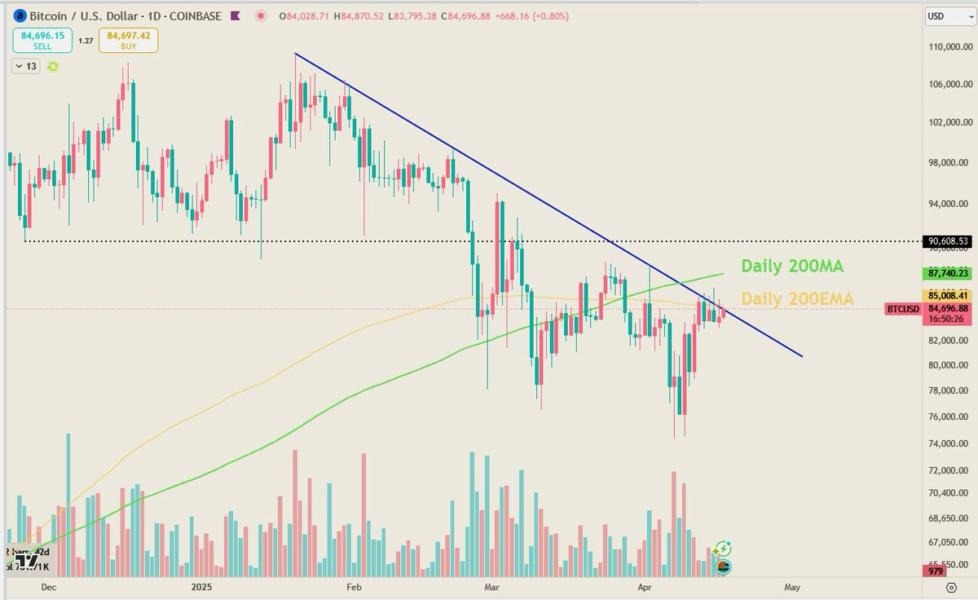
Daan Crypto has conducted a technical analysis of the current BTC market, pinpointing three active resistance factors within the specified price zone. The initial price resistance is characterized by a diagonal downtrend line, shaped by Bitcoin’s ongoing pattern of lower lows and lower highs during the price correction observed over the last three months. For a trend reversal to be established, Bitcoin bulls need to achieve a significant price breakout above this enduring diagonal resistance level.
Among the essential metrics to consider are the 200-day Exponential Moving Average (EMA) and the 200-day Simple Moving Average (MA). These indicators reflect the average prices over the past 200 days, with the EMA placing greater emphasis on more recent price movements. The 200-day EMA plays a crucial role in identifying medium-to-long-term trend shifts, as it responds more swiftly to price fluctuations compared to the 200-day MA, a traditional long-term indicator. Bitcoin needs to surpass both indicators to escape its current consolidation phase and potentially achieve a complete price recovery.
Bitcoin’s ultimate resistance level is currently positioned between $90,000 and $91,000. Bitcoin continues to face challenges within the $84,000-$86,000 price range. Daan Crypto has issued a cautionary note, indicating that the critical test for a potential price reversal lies between $90,000 and $91,000, a level that previously acted as significant support during the earlier stages of the bull cycle. A successful reclaim of this range could position Bitcoin back into a bullish trading environment, indicating a possible resurgence of the broader bull market. As of the latest update, Bitcoin is trading at $84,868, reflecting a modest 0.13% increase over the last 24 hours. In the latest market update, daily trading volume has experienced a significant decline of 42.34%, now standing at a valuation of $12.52 billion.