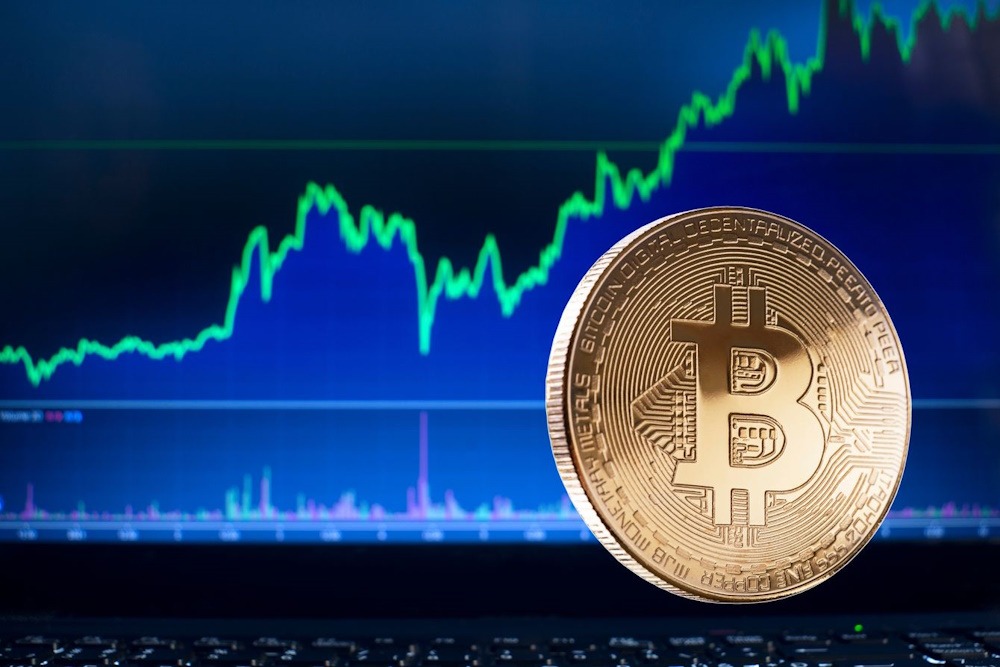
BTC / GNF Live Price

1 BTC - Bitcoin Guinean Franc - GNF

GNF 997,149,000
24 Hour Change : -GNF 11,801,100
24 Hour Change % : -1.17%
24 Hour High : GNF 1,015,200,000
24 Hour Low : GNF 994,546,000
Market Cap : 19844.15 Trillion GNF
24 Hour Volume : 323.18 Trillion GNF
Available Supply : 19.91 Million BTC
Total Supply : 19.91 Million BTC
Country : Guinea

$1 USD GNF 8,678 GNF

BTC/GNF Intraday Chart

BTC/GNF Historical Chart

BTC/GNF - High, Low & Average

Period High
Change from Last
Low
Change from Last
Average
Change from Last
1 Day GNF 1,015,200,000
-18,051,000.00
GNF 993,429,000
+3,720,000.00
GNF 1,008,950,257
-11,801,256.75
5 Days GNF 1,065,690,000
-68,541,000.00
GNF 993,429,000
+3,720,000.00
GNF 1,018,336,870
-21,187,870.13
1 Month GNF 1,071,950,000
-74,801,000.00
GNF 957,366,000
+39,783,000.00
GNF 1,015,855,666
-18,706,665.60
3 Month GNF 1,071,950,000
-74,801,000.00
GNF 852,911,000
+144,238,000.00
GNF 964,819,573
+32,329,426.86
6 Month GNF 1,071,950,000
-74,801,000.00
GNF 647,938,000
+349,211,000.00
GNF 871,094,470
+126,054,530.15
1 Year GNF 1,071,950,000
-74,801,000.00
GNF 423,091,000
+574,058,000.00
GNF 789,729,848
+207,419,152.38

BTC/GNF - Support & Resistance

Support Resistance
R1 GNF 1,018,290,504 S1 GNF 996,519,504
R2 GNF 1,030,721,257 S2 GNF 987,179,257
R3 GNF 1,040,061,504 S3 GNF 974,748,504

BTC/GNF - Moving Averages

Period MA 20 MA 50 MA 100
5 Minutes GNF 1,003,499,554 GNF 1,007,683,771 GNF 1,006,083,285
1 Hour GNF 1,004,479,642 GNF 1,004,479,642 GNF 1,004,479,642
1 Day GNF 1,011,716,924 GNF 1,000,820,701 GNF 959,081,102
1 Week GNF 906,004,346 GNF 799,649,488 GNF 604,967,252

BTC/GNF - Trading Signal

Period Signal
5 Minutes Sell
1 Hour Neutral
1 Day Buy
1 Week Buy

Historical Bitcoin to Guinean Franc Price Movement

The BTC/GNF currency pair reflects Bitcoin’s valuation against the Guinean Franc (GNF). In Guinea, Bitcoin is gaining traction as a hedge against currency devaluation, with adoption primarily driven by remittance needs, limited banking access, and peer-to-peer (P2P) trading ecosystems. BTC/GNF price movements are influenced by global Bitcoin cycles, local economic factors, and regional digital finance initiatives.

Historical Overview of BTC/GNF Price Trends

2017–2019: Informal Adoption and Currency Hedge

  • BTC/GNF surged to GNF 100 million in 2017 amidst global Bitcoin enthusiasm.
  • Limited formal exchange infrastructure led to the rise of informal P2P trading networks.
  • Bitcoin emerged as an alternative to mitigate Guinean Franc volatility and inflation.

2020–2021: Remittance Use and Price Acceleration

  • BTC/GNF climbed to GNF 400 million by November 2021, reflecting global bull market trends.
  • Increased Bitcoin adoption for remittance transactions circumvented high banking fees.
  • Guinea’s fintech community started engaging with regional blockchain initiatives.

2022: Market Correction and Digital Finance Discussions

  • BTC/GNF corrected to GNF 300 million during the global crypto downturn.
  • Governmental discussions began regarding digital financial inclusion strategies incorporating decentralized finance.
  • Community-driven educational programs highlighted Bitcoin’s utility as a financial tool.

2023: Recovery and Regional Policy Alignment

  • BTC/GNF rebounded to GNF 350 million as market conditions improved.
  • Guinea aligned with ECOWAS regional directives aimed at fostering fintech innovation.
  • P2P platforms expanded their presence to facilitate secure and compliant Bitcoin transactions.

2024–2025 (YTD): Halving Surge and Innovation Initiatives

  • Post-2024 halving, BTC/GNF surged to a record high of GNF 600 million.
  • As of April 2025, BTC/GNF consolidates between GNF 580 million–600 million.
  • Guinea’s fintech sector is actively participating in regional sandbox programs for blockchain innovations.

BTC/GNF Yearly Comparison Table

Year Avg. Price (GNF) Year High Year Low Annual Performance Market Factors
2017GNF 90 millionGNF 100 millionGNF 50 million✅ Inflation hedgeP2P networks
2021GNF 380 millionGNF 400 millionGNF 200 million✅ Remittance-driven surgeGlobal bull market
2022GNF 300 millionGNF 310 millionGNF 290 million❌ Correction phaseFinancial inclusion discussions
2023GNF 340 millionGNF 350 millionGNF 330 million✅ RecoveryECOWAS alignment
2025*GNF 590 millionGNF 600 millionGNF 580 million✅ Halving momentumInnovation initiatives

Key Factors Driving BTC/GNF Valuation

  • Remittance Efficiency – Bitcoin is used to reduce cross-border transaction costs.
  • Inflationary Hedge – BTC adoption serves as protection against GNF depreciation.
  • P2P Market Dominance – Informal networks sustain BTC/GNF liquidity amidst limited formal exchanges.
  • Policy Engagement – Guinea’s alignment with ECOWAS digital finance frameworks promotes structured crypto adoption.
  • Global Bitcoin Trends – BTC/GNF price cycles align with international Bitcoin movements.

BTC/GNF Market Structure Insights (2025)

  • P2P platforms remain the primary facilitators of BTC/GNF transactions.
  • Community education initiatives enhance crypto literacy among traders and SMEs.
  • Regional sandbox programs are fostering blockchain solutions aimed at financial inclusion.
  • Efforts are underway to formalize crypto services under Guinea’s digital finance strategies.

Latest Bitcoin News